

This is the first of a three-part deep dive on Shopify (Nasdaq/TSX: SHOP). Part 1 covers the business model and how Shopify actually makes money. Part 2 covers the $2 billion detour, the Amazon threat, and AI. Part 3 covers the financials, capital allocation, and valuation.
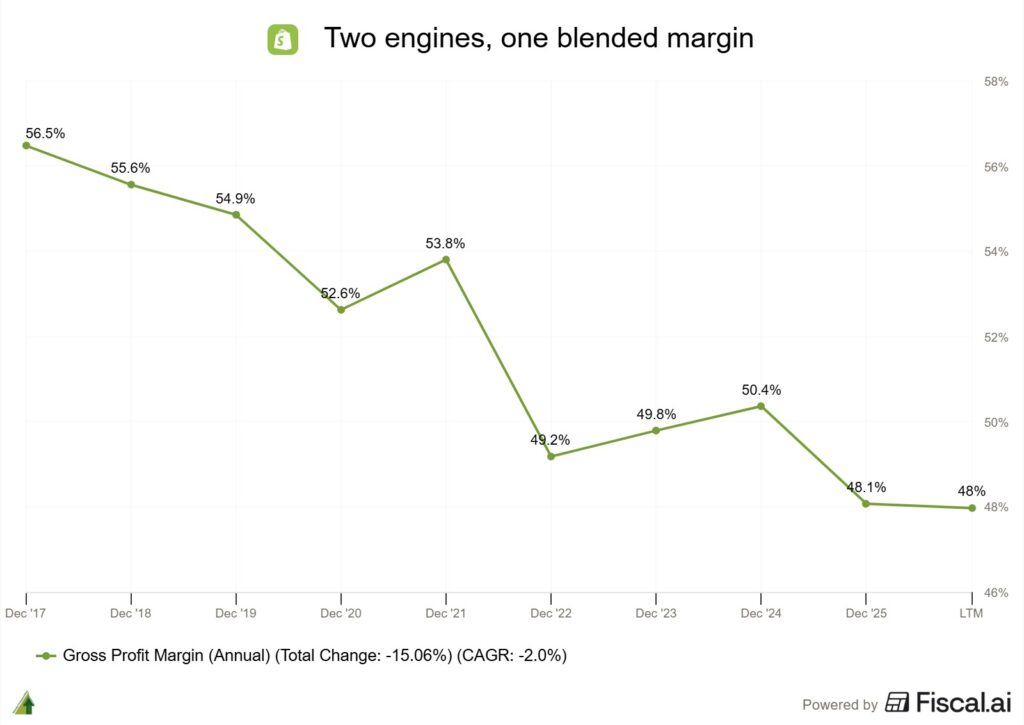
Shopify is a fundamentally different business than it was a decade ago. You can see it in one number: gross margin, down 850 basis points, from 56.5% in FY2017 to 48.0% over the last twelve months (48.1% for full-year FY2025).
Normally, investors would be right to be concerned if a company’s gross margins are declining so significantly, especially when software companies typically have north of 80% gross margins. But in Shopify’s case, it’s largely because they’ve developed a second engine that’s so strong, but with lower margins, that it dragged the blended number down. And there’s a good reason for them to move into this lower-margin business, which I’ll come to later.
Source: Fiscal AI (get a 15% discount using this link)
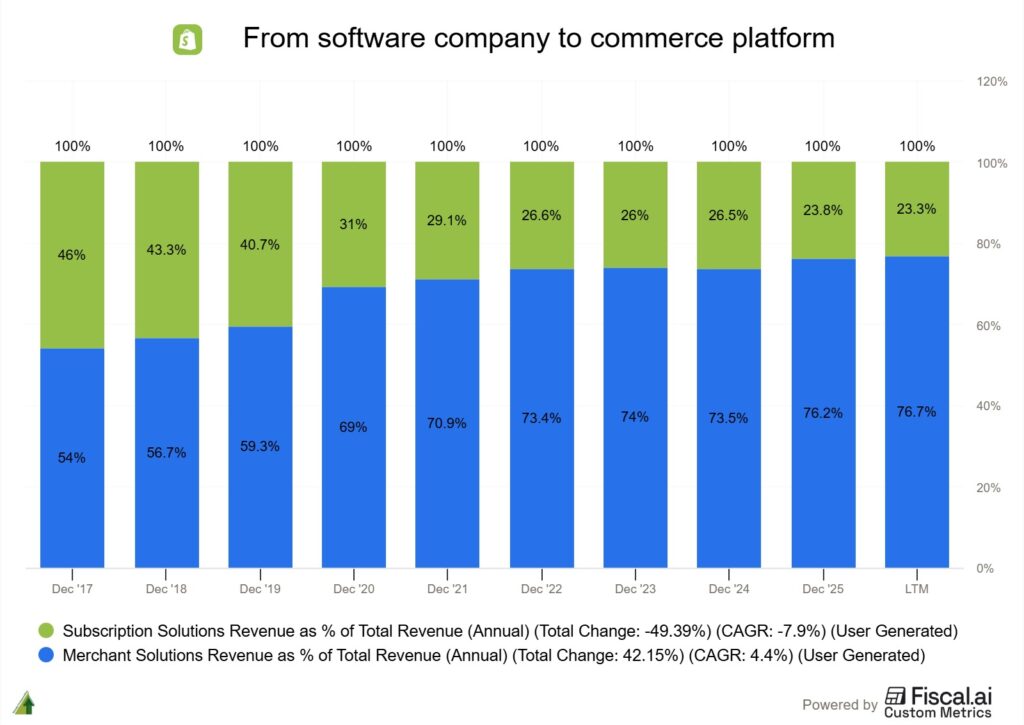
Shopify has two revenue segments.
The first is Subscription Solutions. This is the recurring SaaS revenue, with monthly and annual plans, plus apps, themes and domains. It’s the high-margin, predictable engine, and it has run at roughly an 80% gross margin for as long as the disclosures go back.
The second is Merchant Solutions, and this is the engine that changed everything. It’s a collection of services that make money only when merchants sell things: payment processing, currency conversion, lending, shipping labels, buy-now-pay-later, advertising.
In FY2017, Merchant Solutions was $363M of revenue, about 54% of the company. In FY2025 it was $8.8 billion, about 76% of the company. Subscription went from nearly half of Shopify to under a quarter.
Source: Fiscal AI (get a 15% discount using this link)
The chart almost nobody shows you
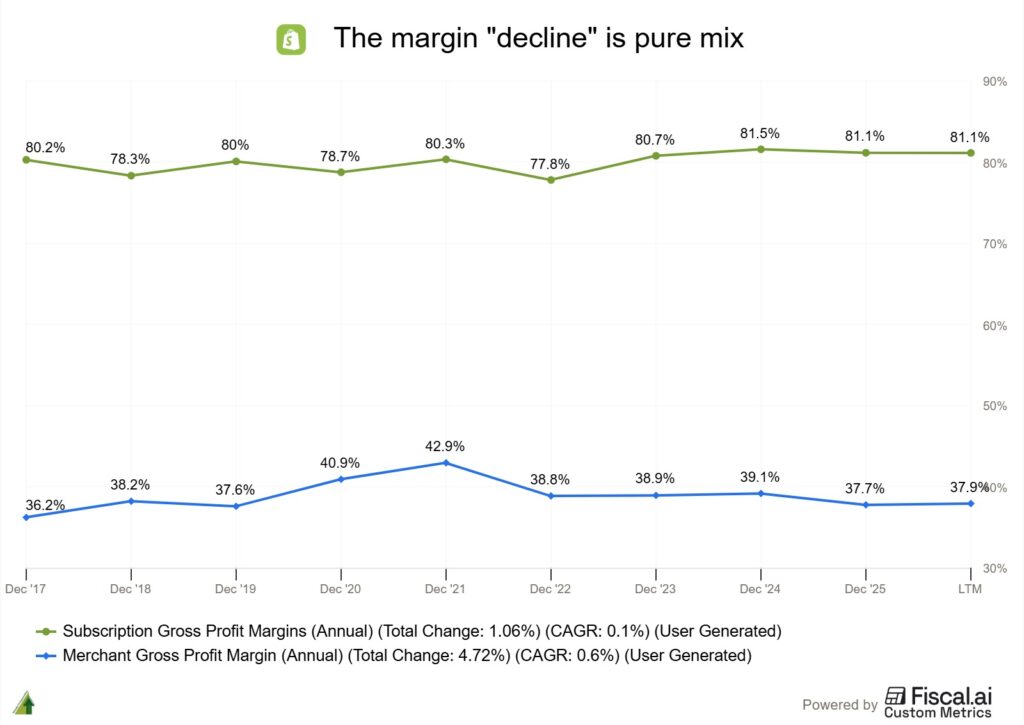
This is where the falling-margin story falls apart. Calculate each segment’s gross margin separately (you can, because Shopify discloses cost of revenue for both) and you find that neither segment’s margin actually declined.
Subscription Solutions gross margin: 80.2% in FY2017, 81.1% in FY2025. Merchant Solutions: 36.2% in FY2017, 37.7% in FY2025.
Both ended higher than they started.
(Sharp-eyed readers will spot the merchant line peaking at 42.9% in FY2021. That was high-margin, non-cash revenue from strategic partnerships temporarily flattering the mix, and the easing since FY2024 partly reflects a PayPal accounting change that books revenue gross at near-zero margin. It’s a band between 36% and 43% rather than a slide.)
Source: Fiscal AI (get a 15% discount using this link)
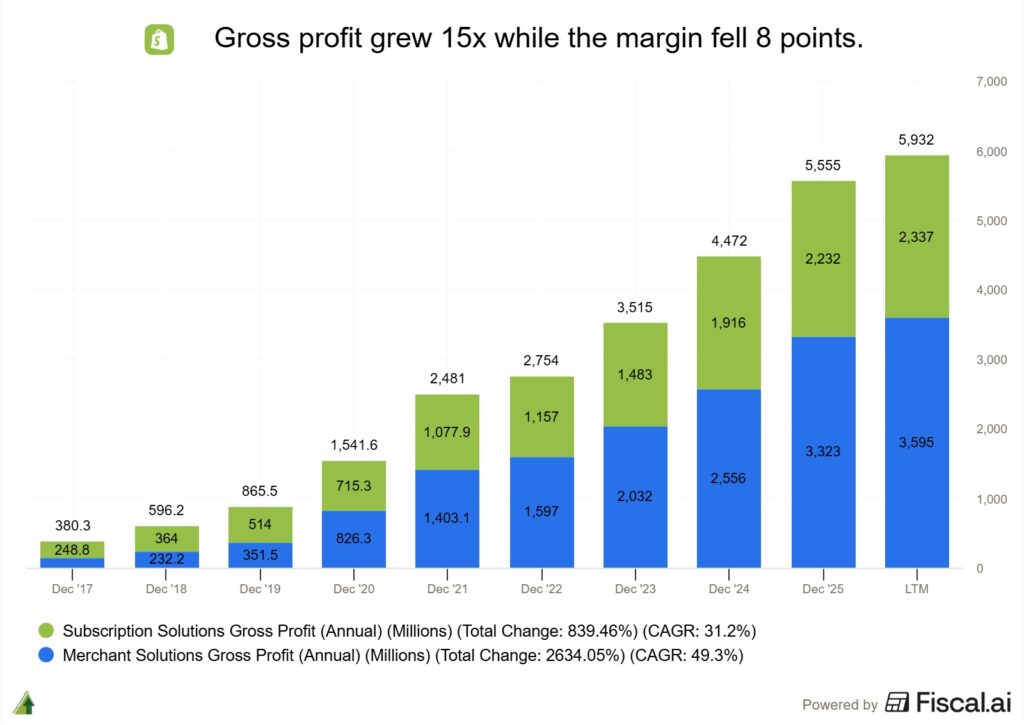
The entire 850 basis point decline in consolidated gross margin is a mix shift. A ~38% margin business grew much faster than an ~80% margin business, and arithmetic did the rest. There was no price erosion, no competitive squeeze, no cost problem. When a bear shows you the falling gross margin chart, this is the chart to show back.
That was what happened, gross profit grew from $380M in FY2017 to $5.56 billion in FY2025, nearly 15x, while the margin drifted down 8 points. I will take that trade every single time, as long as the growth comes with very little capital outlay. And as we’ll see, it mostly did.
Source: Fiscal AI (get a 15% discount using this link)
Too cheap to compete with?
To understand why Shopify built its business this way, start with what it charges next to the platforms a merchant could sell on instead.
Amazon’s all-in take exceeds 50% of seller revenue once you stack the 15% referral fee, 20-35% for FBA fulfillment, and up to 15% for advertising, up from roughly 40% five years earlier, per Marketplace Pulse. Airbnb charges most hosts 15.5% service fee. Booking.com’s commission varies by country, typically 10-25% with a global average around 15%.
Shopify’s take rate in FY2025, measured as total revenue divided by GMV: 3.1%.
One caveat so nobody accuses me of comparing apples to oranges. These numbers aren’t perfectly comparable, because the marketplaces bundle demand generation while Shopify’s merchants bring their own traffic, and Shopify’s 3.1% includes payment processing revenue that carries heavy pass-through costs. Even after every adjustment you want to make, though, the gap is a chasm.
And the gap is deliberate. Charging this little pulls in millions of merchants who don’t want to be beholden to platforms that charge hefty fees, and it makes Shopify brutally hard to attack, because a challenger has to come in under 3% and still fund a platform this deep. Shopify makes little at the front door by design, and earns its money as merchants grow into more of its services, at prices they choose.
What if it’s inability, not strategy?
But let’s flip the argument around, because as an investor, it’s important that we see both sides of the coin. A skeptic can look at the same numbers and conclude that Shopify keeps 3% because it can’t charge more.
Let’s do the math. Merchants moved $378 billion of goods across Shopify in FY2025, and Shopify kept $5.6 billion of gross profit from all that flow. That works out to roughly 1.5 cents of gross profit per dollar of merchandise sold — while Amazon charges north of 50 cents. On that reading, enormous value moves through Shopify’s pipes and the profits accrue to everyone else: the card networks, the app developers, the merchants themselves.
If twelve years pass and prices never rise, is that discipline or a ceiling?
I land on discipline, and the case comes in two steps. First you need to see what Merchant Solutions actually is, because the anatomy explains why the reported take rate understates what Shopify keeps relative to what it merely touches. Then you need to watch how the monetization actually happened over the past eight years, without the take rate moving at all. If this were inability, the last chart in this piece would be flat. It is anything but.
Built on other people’s rails
Dig into the filings and something odd shows up: Shopify’s second engine runs largely on other companies’ infrastructure.
From the FY2025 10-K, cost of merchant solutions “primarily consists of costs that we incur when transactions are processed using Shopify Payments, such as credit card network fees (charged by credit card providers such as Visa, Mastercard and American Express) as well as third-party processing fees.” The 10-K also names the processors outright: Shopify has payment service provider agreements with Stripe and PayPal.
Walk through the components.
Shopify Payments, the bulk of the segment, is a merchant-friendly layer on top of Stripe, PayPal and the card networks. Shopify built the onboarding, the risk and fraud systems, the chargeback protection and, critically, the checkout. It did not build payment rails.
On a $100 order at the Basic plan’s published 2.9% + 30¢, the merchant pays $3.20. Roughly $1.90 of that is interchange going to the buyer’s card-issuing bank, set by Visa and Mastercard and non-negotiable for Shopify or anyone else. Roughly $0.15 goes to the networks and $0.20 to the underlying processor, leaving Shopify something like $0.95, or about 30% of the fee. (The internal split is my illustration using representative US card economics; Shopify doesn’t disclose it. But it reconciles to the reported ~38% segment gross margin once you blend in the higher-margin pieces.)
Shop Pay Installments, the buy-now-pay-later product, is powered by Affirm, which underwrites and funds the loans. Shopify supplies the checkout placement and takes a revenue share.
Shopify Shipping owns no trucks. It buys bulk-discounted carrier rates and resells them to merchants, passing most of the discount through to drive adoption.
POS hardware is manufactured by third parties and sold at close to cost, to pull merchants deeper into payments and subscriptions.
Shopify Capital, the lending product, originates through a partner bank. The piece Shopify actually owns is the underwriting algorithm, which works because Shopify sees every merchant’s live sales data.
And transaction fees, up to 2%, depending on the plan charged when a merchant uses a non-Shopify payment gateway, are nearly pure margin. They exist mostly to nudge merchants onto Shopify Payments.
Every one of these wraps someone else’s capital-intensive infrastructure, whether bank balance sheets, card networks, delivery trucks or hardware factories, in Shopify’s own software, data and checkout, and takes a spread. No warehouses, no fleet, no loan book funded from equity (mostly, and I’ll get to the exception in a moment). That’s why the whole Merchant Solutions build-out consumed so little capital: capex has run at essentially zero percent of revenue for years.
This is also the honest answer to the skeptic’s math in the previous section. Amazon’s 50 cents pays for hundreds of billions of dollars of warehouses, trucks and demand generation. Shopify’s 3 cents pays for software. The profit pools aren’t comparable because the capital bases aren’t comparable, and the fairer comparison is return on the capital deployed. Part 3 will show why that comparison flatters Shopify enormously.
Now the exception I mentioned earlier. Shopify Capital’s loan book, the “loans and merchant cash advances, net” line on the balance sheet, grew from roughly $0.5B at the end of FY2021 to $1.78B at the end of FY2025 per the FY2025 10-K, and standing at $2.1 billion ($2,097M) at the end of Q1 FY2026. The income statement now carries $417M of transaction and loan losses for FY2025, about 3.6% of revenue.
Shopify has sold some of these receivables to third parties in the past, but in FY2025 it sold none, which is part of why the book grew. But a company that lends is a company with credit risk, and days sales outstanding has stretched from 43 days in FY2021 to 71 over the last twelve months.
It doesn’t break the thesis. It’s the one line I’d watch if the economy turns.
One price increase in twelve years
Almost no software company can resist raising prices. Shopify held its subscription prices essentially flat from roughly 2011 to 2023.
When the increase finally came in January 2023, taking Basic from $29 to $39, Shopify from $79 to $105 and Advanced from $299 to $399, the company’s own announcement acknowledged the price “has remained largely unchanged for the last 12 years.”
Twelve years. Through a pandemic e-commerce boom, through the platform adding point-of-sale, international selling, fraud tools and a hundred other features, the front-door price of the software did not move.
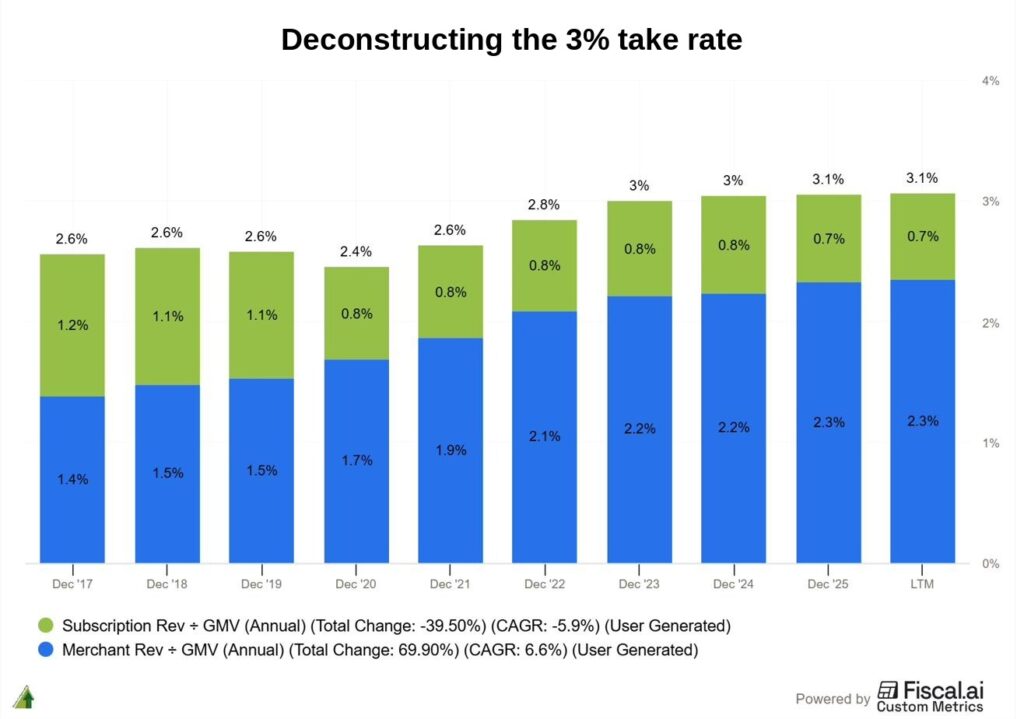
You can see the restraint in the numbers, and a custom metric tells the story better than any management quote. Take subscription revenue divided by GMV, call it the software take rate. In FY2017 it was 1.18%. By FY2025 it had fallen to 0.73%, a decline of nearly 40%. The drop was front-loaded (down to 0.76% by FY2020 as GMV exploded), and then the line flattened.
One detail stands out. The only sustained uptick in the entire series, from 0.75% in FY2022 to 0.78% in FY2023 and 0.80% in FY2024, is the January 2023 price increase showing up in the data. The chart rounds all of those to a flat 0.8%. The bump lives entirely in the second decimal place, which tells you how little even the first price rise in twelve years moved the needle before the mix pushed it back to 0.73% in FY2025.
Meanwhile, Merchant Solutions revenue divided by GMV marched from 1.38% to 2.33%. The extra monetization came from merchants adopting more of the transaction stack, at prices they opted into.
Source: Fiscal AI (get a 15% discount using this link)
Another way to see the same thing: monthly recurring revenue grew about 7x from FY2017 to FY2025 ($29.9M to $205M), while GMV grew about 14x ($26.3B to $378B). The software got cheaper relative to the commerce it powers, and that was the plan.
Management is explicit that this is how they think. Here’s Jeff Hoffmeister, Shopify’s CFO, on the Q2 FY2024 earnings call, when an analyst pushed him on where the take rate goes: “this is an output for us. It’s not an input… We’re trying to drive as much value to merchants as we can, and that will be reflected in the attach rate.”
They manage merchant success and let the take rate fall out the other side.
The payments flywheel
So if prices barely moved, how did revenue grow 17x in eight years against GMV growth of 14x?
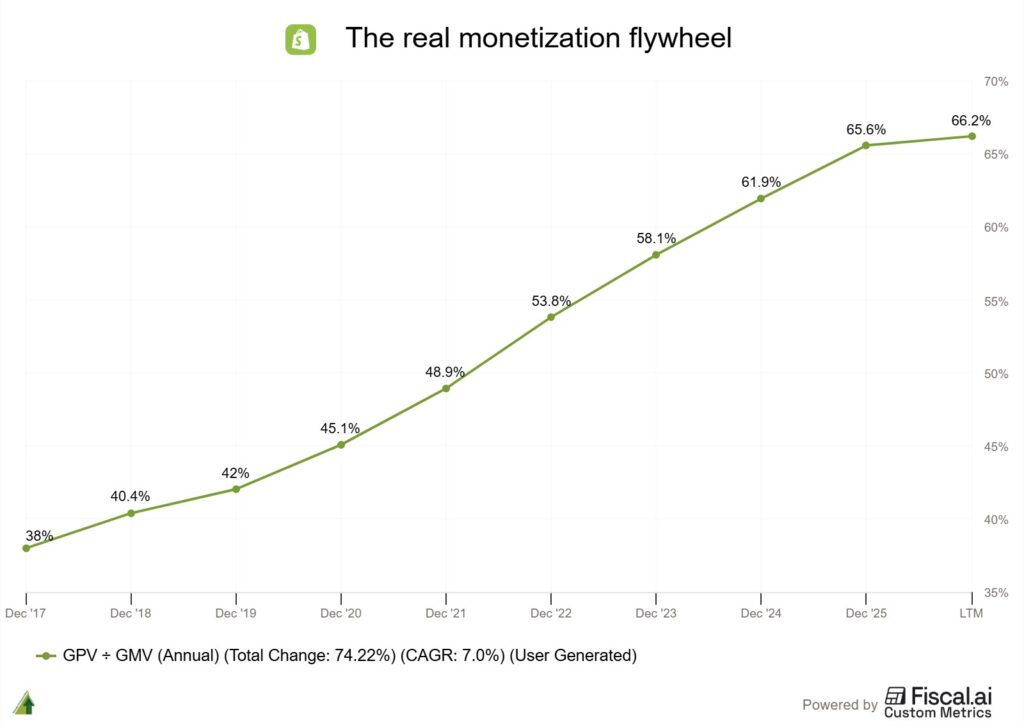
The answer is one line, and it’s the most important chart in this report : Shopify Payments penetration, meaning gross payments volume as a share of gross merchandise volume. In FY2017, 38% of the merchandise flowing across Shopify was paid for through Shopify’s own payments stack ($10B of GPV against $26.3B of GMV). In FY2025 it was 65.6% ($248B against $378B).
Source: Fiscal AI (get a 15% discount using this link)
That’s the whole monetization story in one line. The headline take rate crept from 2.6% in FY2017 to 3.1% in FY2025, barely 50 basis points in eight years, and management will tell you they don’t even steer it. Underneath, the composition transformed: the share of every merchant dollar touching Shopify’s monetized rails nearly doubled. Merchants weren’t charged more. They chose payments first, then installments, then Capital, then tax, then ads.
Harley Finkelstein, Shopify’s President, put the philosophy in one line on the Q3 FY2025 earnings call: “merchants sell more, Shopify makes more, we monetize through GMV, we monetize through Shopify Payments. That will always be the case across any new channel.”
That last phrase, any new channel, is doing more work than it appears. It will matter a great deal when we get to AI in Part 2.
Circle back to the inability question, a company that couldn’t charge more would show a penetration curve going nowhere. Instead, the low price keeps attracting merchants nobody else can serve profitably, the merchants bring GMV, and the GMV gets progressively monetized through services they opt into — and because the price stays low, its tough for competition to undercut it, since you cannot run this platform on less than 3% and still fund the R&D. The price stays low to keep the flywheel fed, and penetration does the earning.
What’s next
There’s a tidier version of this story that ends right here. It would leave out the part where Shopify spent three years doing the exact opposite of everything above.
Between 2019 and 2022, the company decided to stop wrapping other people’s infrastructure and start owning it. It spent over $2 billion buying a logistics company, and ended up handing the whole operation to someone else’s startup in exchange for equity, plus a $1.3 billion write-off.
In Part 2: why they went in, what horizontal versus vertical actually means, whether Amazon’s Buy with Prime was ever the threat it looked like, and whether AI turns out to be the best or worst thing that ever happened to this business.
Compound wisely,
Thomas
Disclaimer: This report constitutes the author’s personal views only and is for educational purposes only. It is not financial advice in any shape or form. Disclosure: I do not hold a position in Shopify at the time of writing (this is a disclosure and NOT a recommendation).