

Quick note: The Lunch Break Investor launches this Tuesday, August 18. This is the last report before pre-orders end, and the free course that comes with them ends too.
>> Pre-order The Lunch Break Investor here
Details at the bottom. Report first.
In my Q4 2025 report I wrote that Shopee’s margin recovery “remains a promise” until the margin line moves upward. In Q1 it moved, but Ramadan fell entirely within Q1 this year, so I set a test to separate a structural inflection from a calendar boost:
“Ramadan fell entirely within Q1 this year (it straddled Q1-Q2 in 2025), giving Q1 a calendar tailwind on revenue. If Q2 margin holds or expands sequentially, the inflection is structural. If it slips back toward Q4 2025 levels, Q1 was partly calendar-aided.”
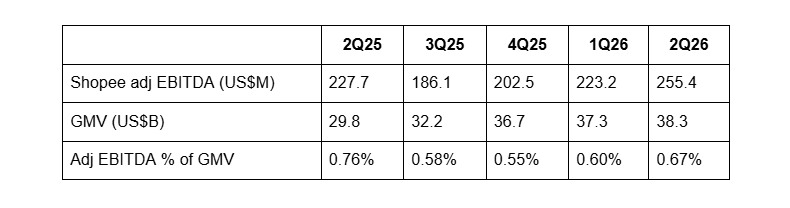
Shopee cleared it cleanly. Adjusted EBITDA as a percentage of GMV rose for a second consecutive quarter from its 0.55% trough in Q4 2025, and Chairman and CEO Forrest Li put a number on the year in his prepared remarks: “With this solid momentum we are optimistic that Shopee will achieve the milestone of $1 billion in adjusted EBITDA for the full year.”
Shopee
Headline financials
- GMV: $38.3B, +28.4% YoY
- Gross orders: 4.2B, +27.5% YoY
- GAAP revenue: $5.6B, +48.2% YoY
- Core marketplace revenue (transaction fees + ads): $4.3B, +65.6% YoY
- VAS revenue (logistics): $676.4M, -9.0% YoY
- Adjusted EBITDA: $255.4M, +12.2% YoY
- Adjusted EBITDA as % of GMV: 0.67% vs 0.76% in Q2 2025
Where the growth came from
Revenue grew 48.2% to $5.6 billion, and by my math the growth splits roughly 60/40 between volume and monetization.
On volume: GMV grew 28.4% to $38.3 billion, driven by a 27.5% increase in gross orders to 4.2 billion, which works out to a steady average order value of $9.12. Monthly active buyers grew 18% year-on-year, purchase frequency rose 8%, and new buyer growth accelerated sharply, with average monthly new active buyers up more than 35% year-on-year. The flywheel continues to gain momentum.
On monetization: core marketplace revenue, which is transaction fees and ad revenue, grew 65.6% to $4.3 billion, 2.3x faster than GMV. Ad revenue rose more than 70%, and the take rate (total revenue over GMV, my standard measure across this series) expanded roughly 200 basis points to an all-time high of 14.6%.
When asked how much more they can raise take rates, management replied:
“When we look at the take rate, we look at take rates from multiple angles. I think one is how much the take rate is reinvesting to grow the ecosystem, which is very important for us to look at. That’s number one.
Number two is we look at how our price competitiveness is in our platform. So essentially after take rate, do we still maintain a similar gap of price leadership or not compared to the other platforms. Number three is we also look at the price of e-commerce essentially on our platform versus the offline pricing. Number four, we also look at what does it mean for sellers’ profitability.
I think we put all the things together in terms of consideration for the take rate. From what we observed so far, we have been [seeing a] very healthy ecosystem even with the increase of take rate. And the reason for that is that we reinvest a large part of the take rate to the ecosystem growth as well, and also that we’re able to help the seller to operate online more efficiently over time with the combination of other things, our price is still very competitive, not only compared to the other marketplaces in our market, but also compared to the offline alternatives in the market.
And going forward, we still see opportunities to increase our take rate, not only from commission, but also from the paid ads we have been able to penetrate more and more over time. Although you can argue that … the pace of the fixed commission increase probably will be less than we observed before. But again, there is still room for us to increase the overall take rate by both helping the sellers to operate more efficient, but also helping the sellers grow their volumes by reinvesting part of the things to the ecosystem and also increase the conversion potential from the buyer side.”
Management is telling us the pace of fixed commission increases will slow from here, which hands the take-rate story to advertising. The ad numbers say that handover is already underway: ad take rate improved by over 90 basis points year-on-year, the number of ad-paying sellers rose around 45%, and average ad spend per seller grew more than 15%.
The VAS line looks ugly on purpose
Value-added services (VAS) revenue, which is logistics, remains a drag, declining 9.0% to $676.4 million. It moves in the opposite direction from GMV growth because Shopee keeps subsidizing shipping heavily. They did the same in their early days, except now they can fund it while staying profitable, and that combination is hard to compete with.
The surface number looks hideous, but management revealed metrics which show the subsidies are doing more than juicing GMV. In Indonesia, instant delivery order volumes grew around 80% year-on-year while cost per order fell around 20%. The same disclosure last quarter showed 35% volume growth with a similar cost decline, so the pace more than doubled in three months while the unit cost decline held. Scaling that fast without cost creep is notable.
Strategically, Forrest Li framed the expansion around groceries and pharmacy, explicitly “high-frequency categories.” Fulfillment is pulling in the same direction: order volumes handled through fulfillment grew more than 20% quarter-on-quarter, and sellers converting to it, where Shopee takes over storage and delivery, see more than a 20% order uplift on average in Southeast Asia.
ShopeeVIP and the Costco playbook
My guess is a meaningful share of the subsidy budget funds ShopeeVIP, which keeps scaling:
- Q1 2025: >1M
- Q2 2025: 2M
- Q3 2025: 3.5M
- Q4 2025: 7M
- Q1 2026: >10M
- Q2 2026: >15M
Across Asia, VIP members contributed 24% of GMV, up from about 20% last quarter, with average monthly retention holding around 80%, and members spend meaningfully more after subscribing. Brazil launched in April and is already past 1 million members.
The funding model is the part that interests me most, because it resembles the Costco playbook: many of the deals in Costco’s member savings program are funded by its suppliers rather than by Costco itself. Shopee is engineering the same arrangement, bringing sellers and partners in to co-fund VIP benefits because the buyer base is worth paying to reach. Forrest Li, in his prepared remarks:
“More sellers and partners have come on board to co-fund benefits, demonstrating the value they see in engaging our ShopeeVIP buyer base. This has helped improve the program’s [unit] economics in Asia.”
My read
I’ve long advocated for management to beef up logistics and build a membership program, because if history is any indicator, being the largest platform isn’t enough of a moat in e-commerce. Durability takes all three working together: scale, logistics and membership. This quarter all three pulled in the same direction, and for the first time in over a year the margin line shows it.
Monee
Monee put up another quarter of very fast growth and paid for it with margin. The question that matters is whether the compression is credit deterioration or mix. I read it as mix, priced for its losses. Here’s the case.
Headline financials
- GAAP revenue: $1.4B, +58.9% YoY
- Adjusted EBITDA: $288.0M, +12.8% YoY
- Adjusted EBITDA margin: 20.5%, down roughly 840 bps YoY
- Loan book: $11.1B, +62.5% YoY ($10.0B on-book + $1.1B off-book)
- NPL 90+: 1.0% vs 1.1% over the prior three quarters
- Active credit users: >40M, up around 34% YoY
Where the margin went
Revenue grew 58.9% to $1.4 billion while adjusted EBITDA grew 12.8% to $288.0 million, compressing the margin by roughly 840 basis points to 20.5%. The bridge has two drags and one offset.
Sales and marketing is the big one, worth roughly 710 basis points. It grew 139.8% to $293.9 million, and the spend goes to three places: prime user acquisition, off-Shopee expansion (users acquired through merchant partnerships rather than the free Shopee funnel), and Brazil scaling.
Provisions are the second drag, worth roughly 370 basis points, growing 75.4% against loan book growth of 62.5%.
Those two add up to more than the total compression, about 1,080 basis points against 840. The difference came back through the rest of the cost base: cost of revenue improved from 13.1% of revenue to 11.3%, and other operating expenses from 9.7% to 8.4%, the same sublinear scaling of collections, bank fees and hosting I flagged in Q1.
Provisions are a mix story, not a credit story
Provisions outgrowing the book would normally worry me. Two things say it shouldn’t, at least not yet.
First, NPL 90+ came in at 1.0%, a tick below the 1.1% held over the prior three quarters. So no clear sign of credit deterioration here.
Second, management’s explanation in the Q&A points squarely at mix. Off-Shopee SPayLater, now past 20% of the total SPayLater portfolio and as high as 35% in some markets, and Brazil both naturally carry higher provisions than the captive on-Shopee book.
On Brazil specifically, management called it “a high interest, high risk market” that nonetheless earns a very good return on assets. Off-Shopee SPayLater runs a naturally lower ROA than the on-Shopee book, again by management’s telling. Both are growing faster than the legacy book, and both are priced for their losses.
Beyond Shopee
Around 5.3 million first-time borrowers were added in the quarter. Active credit users passed 40 million, up around 34% year-on-year, and average loans outstanding per user grew around 20%. All of this sits on a loan book that reached $11.1 billion, up 62.5% year-on-year and about 12% sequentially, split $10.0 billion on-book and $1.1 billion off-book.
In my Q4 report I wrote:
“Monee is no longer just an e-commerce financing tool. It’s becoming a general consumer credit platform.”
This quarter kept saying the same thing. Monthly transacting users on the standalone ShopeePay app more than doubled year-on-year in the second quarter, and the app is live in Indonesia, Thailand, Malaysia and Vietnam. Management confirmed in the Q&A that a similar standalone app is coming to Brazil under the CFI license, which management framed as putting Monee in the same product category there as Mercado Pago. And the Philippines became the fifth market with a loan book above $1 billion.
My read
The margin compression is the cost of Monee becoming a real lender rather than a checkout feature. NPLs ticked down while the book grew 62.5%, the two fastest-growing segments are priced for their losses, and the ROA lens management pointed to says underwriting quality is holding. We are trading away a margin that was never going to survive contact with the open market, and getting a larger, more platform-independent credit business in return. As long as NPLs and ROA hold, that trade works.
Garena
I ended the Garena section of my Q1 report by saying that durable growth eventually requires new users. Three months on, the user question looks exactly the same.
Headline financials
- Bookings: $763.5M, +15.5% YoY
- GAAP revenue: $746.6M, +33.5% YoY
- Adjusted EBITDA: $429.8M, +16.7% YoY
- EBITDA margin on bookings: 56.3% vs 55.7% in Q2 2025
- QAU: 666.3M vs 664.8M in Q2 2025 (+0.2%)
- QPU: 68.1M, +10.2% YoY
- Paying user ratio: 10.2% vs 9.3% in Q2 2025
- ARPPU: $11.2 vs $10.7 in Q2 2025
The step-down from Q1
Bookings fell 18.0% quarter-on-quarter, from $931.4M to $763.5M. But before anyone panics, the same thing happened last year, when bookings dropped 14.7% from Q1 to Q2 2025. Q1 is Garena’s loaded quarter, with the Jujutsu Kaisen collaboration, Lunar New Year and Ramadan all stacked into the same three months, and Q2 simply doesn’t have an event calendar to match it. The year-on-year number is the cleaner read, and at +15.5% it held up fine.
Where the growth came from
Same exercise as last quarter, splitting bookings growth into its three parts:
- QAU: +0.2%
- Paying user ratio: 9.3% to 10.2%
- ARPPU: $10.7 to $11.2
Active users contributed almost nothing. The paying ratio and ARPPU did all the work, which is the same pattern from my last three reports: Garena is monetizing the base it already has, not growing it.
CFO Tony Hou attributed the growth to “the increase in our active user base and deeper paying user penetration.” I’d quibble with the first half of that. QAU grew 0.2%. Nearly all of this came from deeper monetization.
The gap between revenue and bookings
GAAP revenue grew 33.5% while bookings grew 15.5%, and the difference is deferred revenue. Garena collects the cash upfront when players top up, then recognizes it as revenue over time, which is why Sea reports bookings as the approximation of what players actually spent in the quarter.
In other words, revenue is now catching up on cash collected in earlier quarters, so the flashy 33.5% is mostly old bookings being recognized. Bookings is the better gauge of what players spent this quarter.
The user base still isn’t moving
Six quarters of QAU: 661.8M, 664.8M, 670.8M, 633.3M, 666.5M, and now 666.3M. My Q1 watch item was a clean break above the 670.8M peak from Q3 2025. It didn’t happen, and Q2 landed 4.5M below that peak.
The paying ratio slipped to 10.2% from 10.9% in Q1. This is probably seasonal, so I won’t read too much into it.
Arena of Valor went unmentioned
In Q1, Chairman and CEO Forrest Li told us “we expect 2026 to be a record year for Arena of Valor,” and I put AoV’s anniversary slate on the watchlist. On the Q2 call, Arena of Valor did not come up once, in the prepared remarks or the Q&A.
One quiet quarter is not evidence of anything, and I’m not going to read weakness into an absence. But when management makes a commitment that specific, I expect a progress update the following quarter, and we didn’t get one.
The new games
Two titles were announced. Palworld Online is an open-world survival game that Garena is developing itself under license from Pocketpair, and management confirmed in the Q&A that it will be published globally, rolled out market by market. Monster Hunter Outlanders is developed by Tencent on Capcom’s Monster Hunter IP, with Garena publishing in Southeast Asia, Latin America and Taiwan, and possibly the Middle East. The target launch is this year.
Free Fire is the ninth year and AoV is tenth. Both show Garena can operate a game well over a very long horizon, and I wrote last quarter that what neither proves is whether Garena can mint a genuinely new hit. These two titles will once again put this to test, and hopefully we won’t have to wait long for the early returns.
My read
Nothing about the core picture changed this quarter. Garena is still a monetization-led business sitting on a flat user base, with excellent margins and a paying ratio approaching its own historical ceiling.
The group picture
Zooming out: consolidated revenue was $7.8 billion, up 48% year-on-year, adjusted EBITDA was $917 million, up 10.6%, and net income grew 10.6% to $458.1 million. Sea also repurchased 4.7 million shares for $416.8 million during the quarter under its $1.0 billion buyback program.
Sea also repurchased 4.7 million shares for $416.8 million under its $1.0 billion buyback program. That works out to roughly $88 per share. No idea if management aimed for an auspicious number, and if I were an analyst on the call I would have joked about it. Either way, I think they bought well at that price.
This was a strong quarter, carried by Shopee and Monee. The missing piece is Garena growing users again. Monetizing a stable base is good. Growing the base while monetizing it is better. That is the higher-quality version of this story, and it is what I want to see next.
Last quarter I set a test for Shopee’s margin. This quarter I checked it. That’s the whole method behind this report: know what you’re looking for before the numbers arrive, then let the filing answer.
It’s also the method in my book. The Lunch Break Investor launches this Tuesday, August 18. Six steps to analyze a business in about an hour a day.
Pre-order before Tuesday and The Owner’s Manual comes free. Three lessons on reading financial statements, the same skill behind every number in this report.
The book arrives August 18. The course arrives today.
>> Pre-order: steadycompounding.com/book