
I recently watched John Huber’s presentation at the FinTwit Summit on the three engines that drive stock returns.
Here are my notes!
The three main engines that drive stock returns:
– Earnings growth
– Change in P/E multiple
– Change in shares outstanding
Companies that benefit from all three engines score the biggest home runs.
In other words:
– Earnings grew over time
– P/E multiple expansion
– Buy back shares
Here’s an example 👇
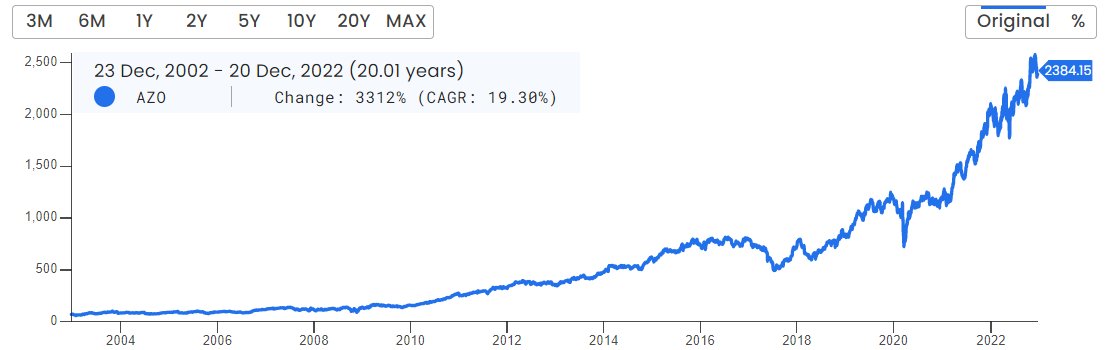
Autozone the buyback monster
Over the last 22 years:
– Autozone earnings grew 8.9x (10% CAGR)
– P/E increased from 13 to 19 (2% CAGR)
Combining earnings growth and P/E expansion, it comes up to 12% CAGR over 22 years.
BUT! It was a 76-bagger since 2000.
Compounding at whopping 22% CAGR.
Why?
Share buybacks.
The company had a huge appetite for buying back its own shares.
Since 2000, Autozone bought back 83% of its shares.
Existing shareholders 6x their ownership without having to buy an additional share.
This was possible because Autozone has 30% ROIC & gushing with FCF
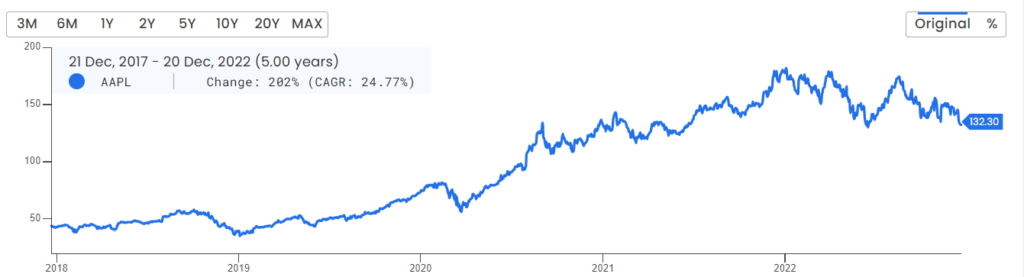
Similarly, Apple repeated Autozone’s playbook
Since 2016, Apple has also enjoyed 3 engines.
– Earnings engine: 8% CAGR
– P/E engine: 20% CAGR (from 10x to 30x)
– Buyback engine: 6% CAGR (share count declined 28%)
All 3 engines produced a 37% CAGR over the past 6 years!
The 10 year test
A key criteria to applying this mental model:
10-year test Is this company durable enough for you to forecast 10-years into the future?
Otherwise, move on to the next one.
Summary:
– Build a list of durable companies that pass the 10-year test
– Estimate earnings in 10 years
– Estimate P/E in 10 years
– Estimate shares outstanding in 10 years
Buy if it passes your hurdle rate.