


Peter Lynch achieved a legendary 29% annualized return during his 13 years running the Fidelity Magellan Fund.
He had over 1,400 stocks in his portfolio at one time, making him one of the most experienced stock pickers and one of the most versatile investors.
How did he accomplish that? Here’s his secret of picking stocks.
#1 Smaller companies make bigger price movements
“The size of a company has a great deal to do with what you can expect to get out of the stock. How big is the company in which you’ve taken an interest?”
— Peter Lynch
In comparison to smaller companies, big companies are less likely to have major price movements. It is easier for a company with $1 million in earnings to quadruple over two years than Apple with $102 billion in earnings.
The company sold 242 million iPhones and there is a limit to how many iPhones can be sold. I’m oversimplifying things but you get the picture.
Since they have more room for growth, smaller companies generally offer higher returns.
#2 The Peter Lynch Playbook
After determining the size of the company relative to others in a particular industry, Peter Lynch will place them into one of the following six categories:
The Slow Growers
This group of companies grows slowly between 2% to 5%, just slightly faster than the gross national product.
They are usually large and aging companies who used to be a fast grower before.
When an industry at large slows down, most of the companies inside the industry lose momentum and eventually slow down their growth.
One of the signs to identify slow growers is that they pay a generous and regular dividend, because they can’t dream up new ways to use the money to expand their business.
This attracts investors with a preference for dividend-paying stocks and a stable dividend payout makes it easier for investors to hold through a downturn.
Why? Let’s say Stock A is priced at $20 and has long records of paying $2 per share dividend, so the dividend yield is 10% ($2 /$20). When the stock price drops to $10, the yield suddenly becomes 20% ($2/ $10)!
Lynch isn’t a big fan of slow growers but keep some to keep his portfolio anchored during a recession or a drawdown.
The Stalwarts
Similar to slow growers, a stalwart is a huge company that can grow but a little faster at an annual growth rate of 10% to 12%.
They are also big companies that are unlikely to go bankrupt and can survive recessions. When their stock price is dragged down in a market crash, their P/E ratio will also drop to the low end of its P/E range.
But soon after the market has recovered, they will be reassessed, and their value will be restored.
Similar to the slow growers, stalwarts that pay generous dividends may suffer less in a market drawdown because of the price floor effect explained in the above.
In this way, stalwarts can offer good protection during recessions and hard times. So although Peter Lynch said it’s unusual to get a tenbagger out of the stalwarts, he always keeps some stalwarts in his portfolio.
The Fast Growers
Fast growers are Peter Lynch’s favorite investments, because this is the wonderland of the 10- to 100 baggers.
He defines fast growers as “small, aggressive new enterprises that grow at 20 to 25 percent a year”, and a fast-growing company doesn’t have to belong to a fast growing industry.
An example of fast growers would be WalMart, who succeeded in one place and duplicated the winning formula to expand at an incredible speed.
Peter Lynch looks for fast-growing companies that have good balance sheets and are making substantial profits, then figures out when the companies will stop growing and how much to pay for the fast growth rate.
The Cyclicals
A cyclical is “a company whose sales and profits rise and fall in regular if not completely predictable fashion”.
The autos and the airlines, tire companies, steel companies, and chemical companies are cyclicals, since there will be a greater demand for cars, travels, materials, etc. in the good times, and a decrease in demand in the hard times.
The performance (and stock price) of cyclicals would be affected by the boom and bust of the economic cycle, and the trick is detecting the early signs that business is falling off or picking up.
Knowing your cyclical and the business cycle well, keeping a close watch on inventories and the supply-demand relationship will help you to find out which part of the cycle the company is in, and help you predict the latter trend.
If you don’t have an investor edge, you can just wait for things to get better, e.g. price to get better, inventories to go down. These could be signs that tell you the upturn in a cyclical industry.
Turnarounds
Turnarounds can be described as companies that had been battered, almost on the brink of bankruptcy but eventually managed to turn things around.
It’s important to look at the company’s debt structure to ensure that a turnaround candidate can survive through the crisis.
A successful turnaround stock can make up lost ground very quickly, and its ups and downs are least related to the general market.
The Asset Plays
An asset pay is any company with valuable assets that you know about but the Wall Street experts overlook.
The hidden assets could be anything whose true market value is not reflected on the balance sheet, such as a company’s brand name, patents, a pile of cash, real estate, or sometimes even in a company’s losses.
Here is a good example of asset plays from his book:
Penn Central:
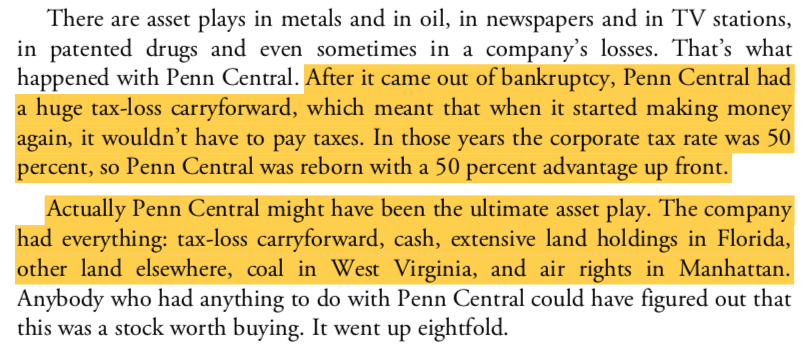
#3 The two-minute drill
Peter Lynch practice giving a two-minute monologue that covers (1) the reasons why he’s interested in the stock, (2) what will make the company succeed and (3) the pitfalls that stand in its path before he buys the stock.
“Once you’re able to tell the story of a stock to your family, your friends, or the dog (and I don’t mean ‘a guy on the bus says Caesars World is a takeover’), and so that even a child could understand it, then you have a proper grasp of the situation.”
What should be covered in this two-minute drill? The answer depends on how you classify the company into one of the six categories in the Peter Lynch playbook.
If the company you own is a slow grower, you should be able to tell how many percent of the earnings are being paid out as dividends.
If it’s a fast grower, what’s the growth rate in recent years? Does the company still have room to grow?
If it’s a turnaround candidate, how is its debt structure? What plan does the company have to save its business and how are things going to turn out?
Lynch reveals that he often spends multiple hours on this drill. He doesn’t take it lightly. He relies on it to avoid investment disasters and to generate world-class returns.
One Up On Wall Street by Peter Lynch is one of the books I recommend to beginners because he breaks down complicated concepts into an entertaining and educational read.